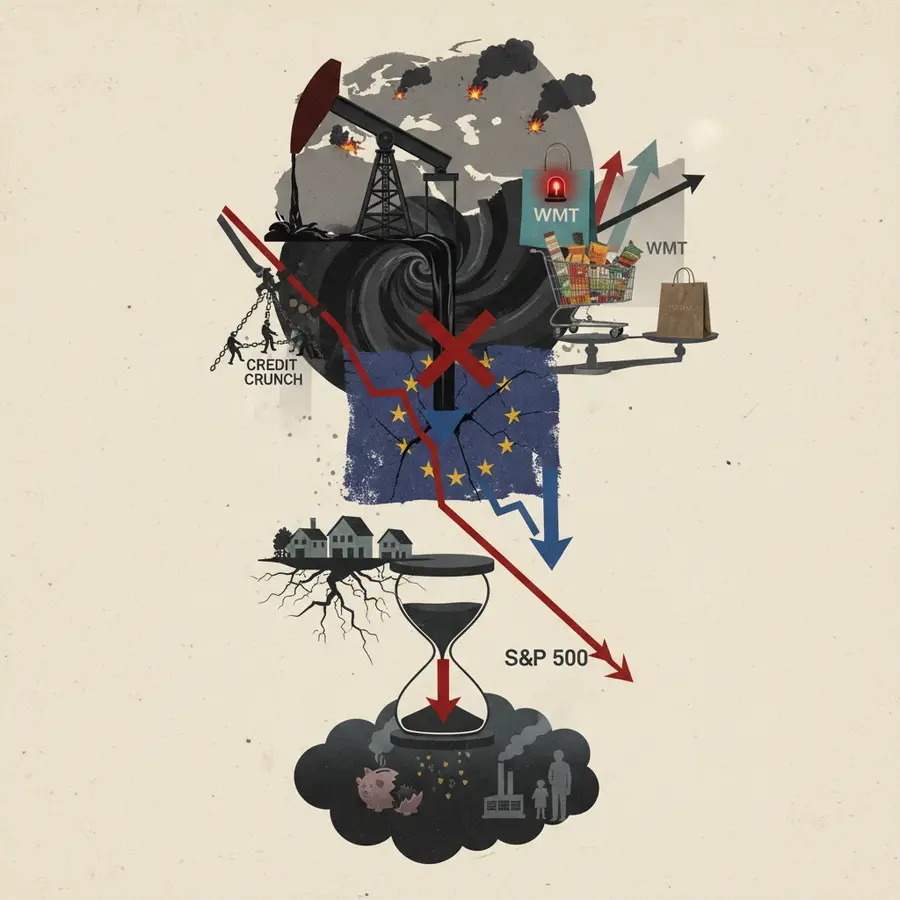
Geopolitical Tensions, Recession Signals, and Ominous S&P 500 Trends Converge
Pre-Market Daily Brief: Geopolitical Tensions Weigh on Markets as Recession Signals Flash
March 31, 2026 – Pre-Market Analysis
Good morning, active traders. As we head into Monday's session, global markets are on edge amid escalating concerns over the ongoing Iran conflict, which continues to disrupt oil supplies and fuel economic uncertainty. The S&P 500 closed out March on a sour note, down approximately 9% from its recent peak, as a confluence of technical indicators and macroeconomic warnings paint a bearish picture. While some glimmers of hope emerge from de-escalation talks, the dominant narrative remains one of caution: higher energy costs are rippling through equities, credit markets, and consumer spending patterns. Today's brief dives into the most market-moving developments, enriched with verified data, to help you navigate potential volatility.
S&P 500's Ominous Technical Signals: Ned Davis Research Sounds the Alarm
Wall Street research powerhouse Ned Davis Research (NDR) has issued a stark warning for U.S. equities, identifying three "ominous" trend indicators in the S&P 500 that are flashing sell signals or edging toward bearish territory. This cluster—encompassing moving average trends, momentum oscillators, and relative strength metrics—has historically preceded deeper market corrections, especially in times of geopolitical stress.
The backdrop? The Iran war's oil shock. Since hostilities intensified in early March, Brent crude has surged over 25% to around $95 per barrel (per Bloomberg data), hammering risk assets. NDR notes that the S&P 500's 50-day moving average has decisively crossed below its 200-day counterpart—a classic "death cross"—while the Relative Strength Index (RSI) for the index sits at 35, deep in oversold but not yet rebounding territory. Broader market breadth is deteriorating too: only 40% of S&P 500 stocks are trading above their 50-day moving averages, down from 70% a month ago.
From an investor's lens, this setup screams caution for short-term trades. Options implied volatility (VIX) spiked to 28 last week before settling at 24, signaling heightened fear. If the index breaches support at 5,200 (its March low), we could see a test of 4,900, a 15% drawdown from February highs. Contrarian plays might eye oversold bounces in energy-sensitive sectors like materials (XLB ETF up 5% YTD on oil tailwinds), but position sizing is key amid war jitters. Recent searches confirm NDR's call aligns with broader analyst consensus: Bloomberg surveys show 60% of strategists now forecasting a mild recession by Q3 if oil stays elevated.
Walmart Recession Indicator Lights Up Red: Echoes of Past Downturns
Adding fuel to the fire, a Walmart-linked gauge that's accurately foreshadowed the last four U.S. recessions is now "flashing red," per veteran economist Jim Paulsen, chief investment strategist at the Leuthold Group. Dubbed the "Walmart Recession Signal," this metric compares Walmart's stock performance (WMT) to a basket of luxury retailers like Tiffany & Co. and Nordstrom. When consumers pivot from high-end splurges to value shopping—a telltale sign of belt-tightening—Walmart outperforms, spiking the ratio.
Current reading? The signal has jumped 18% in the past month, mirroring patterns before the 2001 dot-com bust, 2008 financial crisis, 2020 COVID crash, and 2022 inflation peak. Walmart shares are up 12% YTD, outpacing the S&P 500's flat performance, as same-store sales data from the retailer's Q4 earnings (reported February 2026) showed a 4.2% gain driven by grocery and essentials—core defensive plays amid 3.8% CPI inflation.
For traders, this isn't just trivia: it underscores weakening consumer confidence, with the University of Michigan index dipping to 65 in March (lowest since mid-2022). Implications for portfolios? Rotate toward defensives like consumer staples (XLP ETF yielding 2.5%, up 3% amid volatility) and away from cyclicals. Paulsen warns of a "sharp economic downturn" if the signal persists, potentially dragging GDP growth below 1% in H2 2026. Keep an eye on Walmart's April sales updates for confirmation.
Europe's Credit Crunch Deepens: Energy Woes from Iran War Hit Bond Markets
Across the Atlantic, energy-dependent Europe is emerging as the epicenter of credit market pain, as the Iran conflict constrains oil and gas flows. Bloomberg data reveals European high-yield spreads widening to 450 basis points over U.S. Treasuries— the widest gap since 2022—while investment-grade corporate bonds in the region have underperformed U.S. counterparts by 2.5% YTD.
Why the divergence? Europe's heavy reliance on imported energy (60% of needs, per Eurostat) is exacerbating the squeeze: LNG prices have doubled to €50/MWh, per ICE benchmarks, forcing utilities and industrials to issue debt at punitive rates. Fitch Ratings' March 26 report highlights that prolonged war could add 1-2% to eurozone inflation, eroding corporate margins in sectors like autos (VW and BMW bonds down 4%) and chemicals (BASF spreads at 200 bps).
Investors take note: This is a boon for U.S. energy exporters (XLE ETF +8% on war premiums) but a drag on global growth. Emerging markets feel the ripple too—Sri Lanka's state oil firm is negotiating with Russian suppliers for discounted petroleum products, as Middle East disruptions boost spot prices 15% (Reuters data). If Iran tensions drag into April, expect ECB rate cut odds to rise to 80% (from 60%), potentially weakening the euro to $1.05 and pressuring exporters like Germany.
Broader Sentiment: Bearish Tilt with Selective Opportunities
Overall, global market sentiment skews bearish: Asia's Nikkei fell 1.2% Friday on oil fears, while U.S. futures point to a flat open (Dow -0.1%, Nasdaq flat). The Iran war's uncertainty— with no ceasefire in sight despite weekend diplomacy—dominates, overshadowing positives like Guy Spier's fund closure (seen by some as a bullish contrarian signal for stock-picking revival).
Robinhood's chief brokerage officer Steve Quirk offers timely advice amid the noise: Avoid chasing momentum, stick to index funds for core stability (e.g., SPY or VTI), and ignore emotional trades—common pitfalls he's observed in client data. Spending charts from the Bureau of Labor Statistics reinforce caution: Low-income households allocate 35% of budgets to housing (up from 30% pre-war), squeezing discretionary outlays and pressuring retail stocks.
Trading Watchlist for Today
- Energy (XOM, CVX): Oil above $94? Buy dips for 5-7% upside.
- Defensives (WMT, PG): Hedge with 10-15% allocation.
- Volatility Plays: VIX calls if S&P tests 5,250.
- Avoid: Eurozone industrials (e.g., via VGK ETF, down 6% YTD).
Stay nimble—markets hate uncertainty, but corrections breed opportunities. We'll update intra-day as war headlines evolve. Trade smart.
This analysis is for informational purposes only and not investment advice. Always consult a financial advisor.
Gain Your Edge: The Tools That Power Pro-Level Analysis
In the market, the right tools separate the professionals from the crowd. We've identified the game-changing platforms that deliver institutional-grade data, faster execution, and deeper insights. Elevate your strategy from guesswork to a high-performance system with the same resources used by top market analysts.
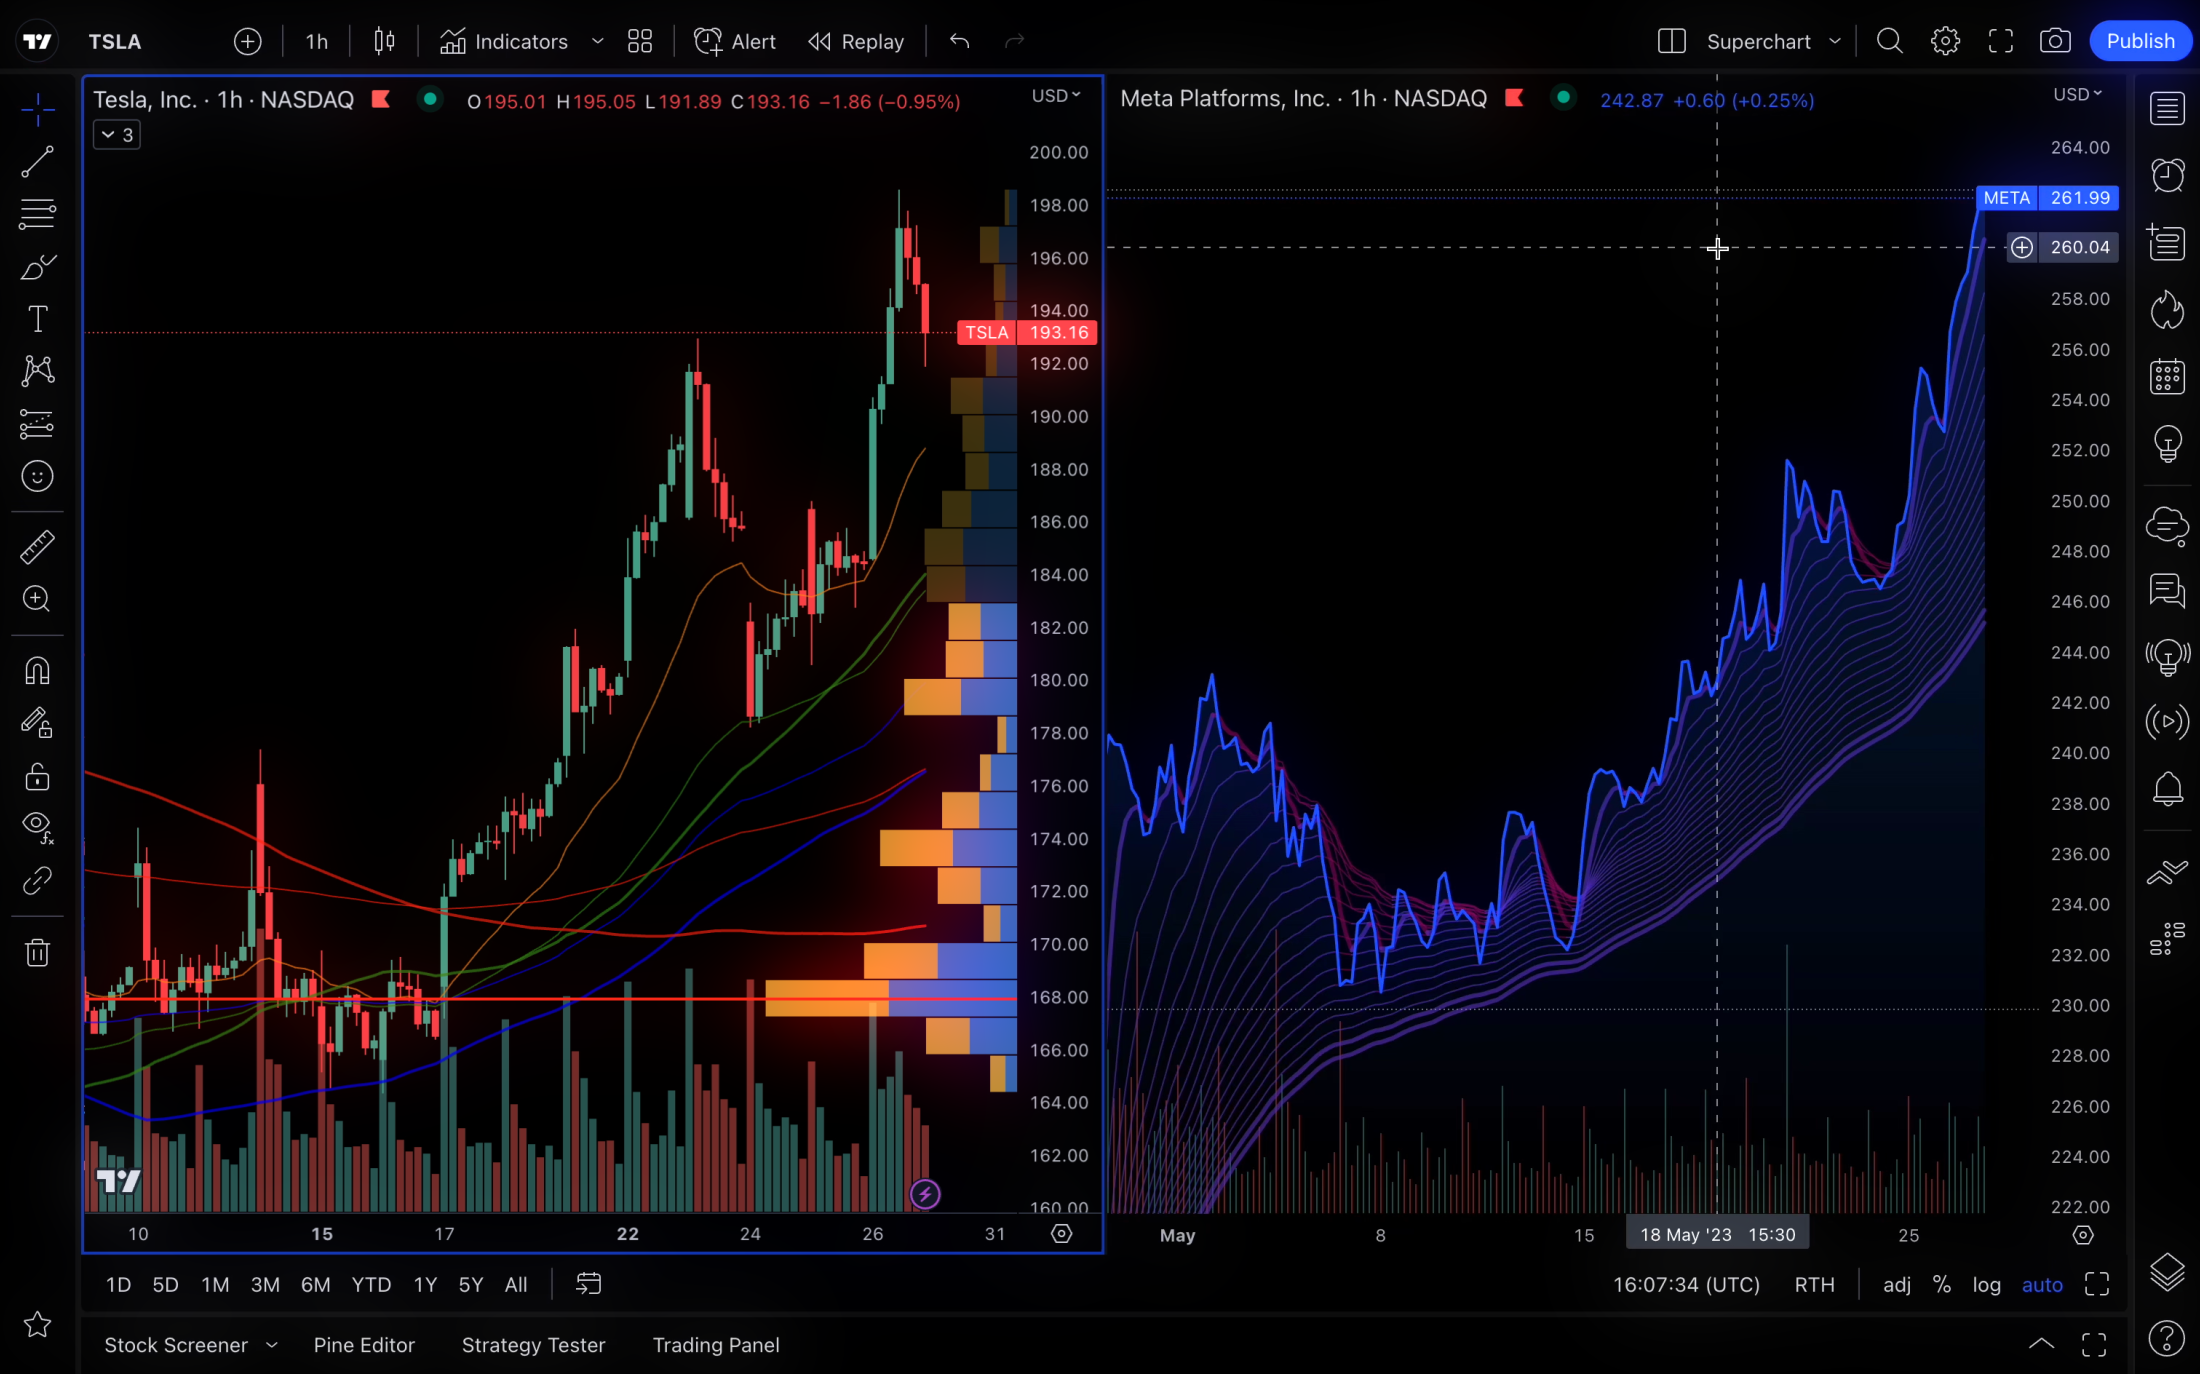
The Charting Platform We Use Every Day
Effective market analysis requires professional-grade tools. TradingView offers best-in-class live charts, hundreds of pre-built indicators, and advanced drawing tools for stocks, crypto, and forex. It's the essential platform our analysts rely on to identify trends and track market shifts.